
Sample post - Using R in R Markdown
Overview
This sample post teaches you my preferred approach for authoring new posts that need to execute R code. The post includes a table of contents and code highlighting. The post content covers interactive HTML tables via the DT package, static graphs via the ggplot2 package, and interactive plots via the plotly package.
View the source code on GitHub.
Document metadata
As seen in the source code, the metadata is the information between the --- markers at the top of the source code. Here is where you specify information such as the document author, date, summary, table of contents, code highlighting scheme, tags, and categories.
The metadata for this document contains the following information in the structure shown:
title: Sample post - Using R in R Markdown
author: Danny Morris
summary: This post demonstrates the use of DT, ggplot2, and plotly R packages for rendering beautiful tables and graphs in an R Markdown document.
date: '2021-04-22'
output:
  blogdown::html_page:
    highlight: tango
    toc: true
slug: []
Description: 'Add additional information about the post using keywords to improve SEO'
Tags: [R, R Markdown, Data Visualization]
Categories: [R, R Markdown, Data Visualization]
DisableComments: no
editor_options:
  chunk_output_type: console
Load R packages
I prefer to load all R packages needed for the current document in a single code chunk near the top of the document.
library(readr)
library(dplyr)
library(tidyr)
library(ggplot2)
library(DT)
library(plotly)
Read data
This sample post analyzes Covid-19 data.
covid_ny <- read_csv("https://raw.githubusercontent.com/nytimes/covid-19-data/master/us-states.csv") %>%
  filter(state == "New York")

# print the raw tibble (data.frame)
covid_ny
## # A tibble: 430 x 5
## date state fips cases deaths
## <date> <chr> <chr> <dbl> <dbl>
## 1 2020-03-01 New York 36 1 0
## 2 2020-03-02 New York 36 1 0
## 3 2020-03-03 New York 36 2 0
## 4 2020-03-04 New York 36 11 0
## 5 2020-03-05 New York 36 22 0
## 6 2020-03-06 New York 36 44 0
## 7 2020-03-07 New York 36 89 0
## 8 2020-03-08 New York 36 106 0
## 9 2020-03-09 New York 36 142 0
## 10 2020-03-10 New York 36 173 0
## # … with 420 more rowsPrinting HTML tables using DT
The DT R package generates attractive, feature-rich HTML tables from R data frames.
DT::datatable(covid_ny)Static charts using ggplot2
ggplot2 is the leading data visualization pacakge among R users.
covid_ny %>%
  gather(key, value, cases, deaths) %>%
  ggplot(aes(x = date, y = value)) +
  facet_wrap(~key, scales = "free_y") +
  geom_line(color = "#02718f") +
  labs(title = "Cumulative Covid-19 cases and deaths in the state of New York, USA") +
  theme_bw()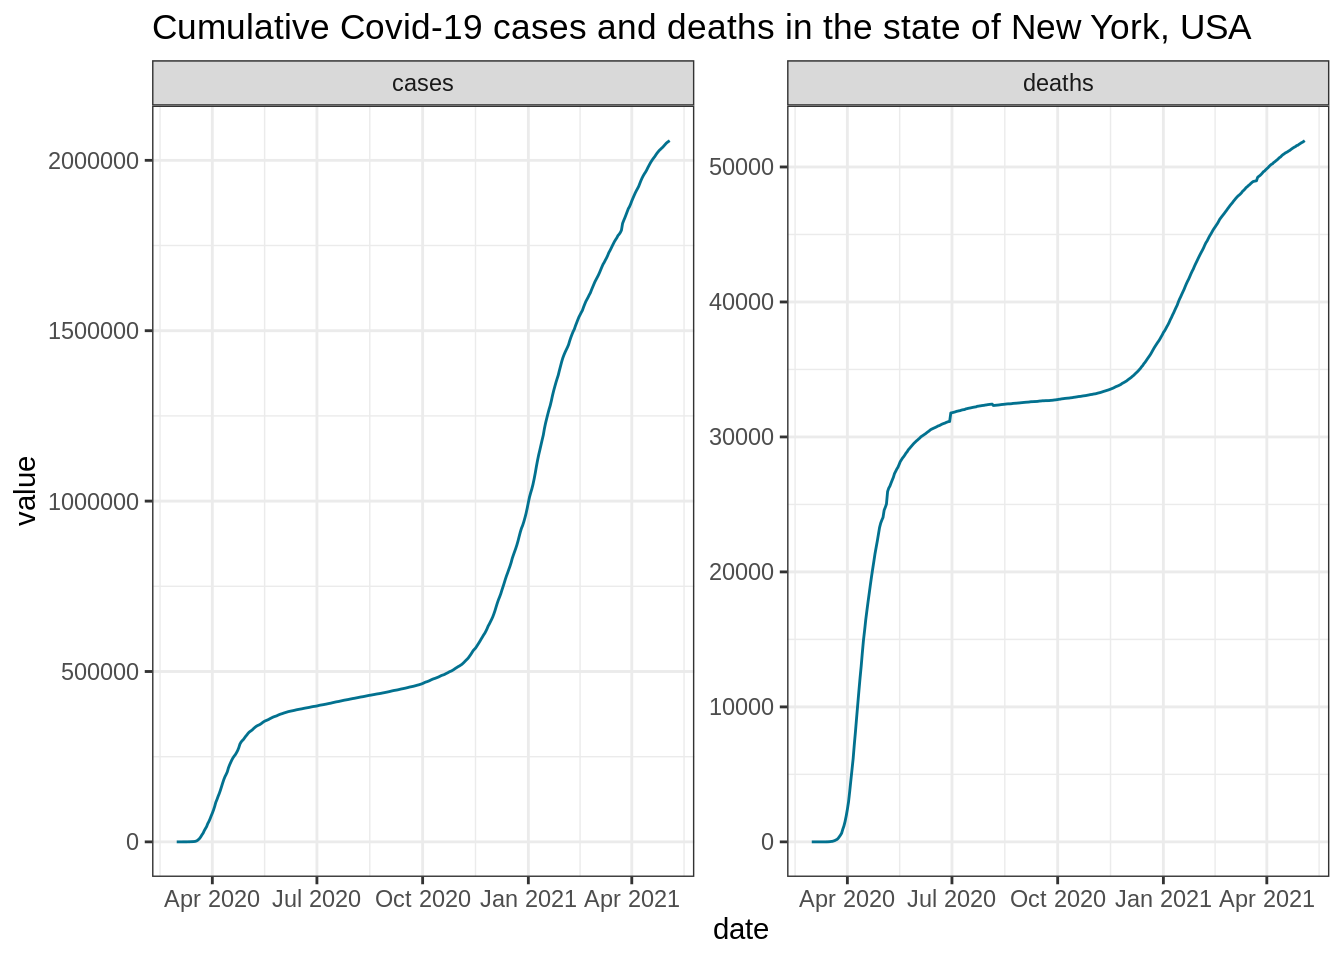
Interactive charts using plotly
The plotly package is an R interface to Plotly, an interactive data visualization library.
covid_ny %>%
  plot_ly(x = ~date, y = ~cases) %>%
  add_markers() %>%
  layout(title = "Cumulative Covid-19 cases and deaths in the state of New York, USA")